The page for Analysis with Outlier and Missing Value has how to handle data with missing values , but this page is more specific when using R.
First, how missing values ??are in the data and how they are handled in R.
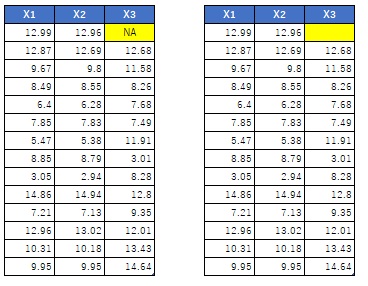
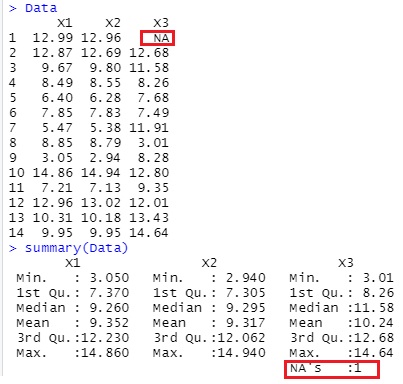
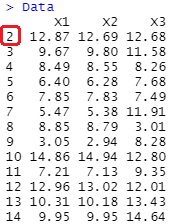
As shown below, the missing value may be literally missing and blank, or the missing value may be the string "NA".
Both become "NA" when read into R. Looking at the summary, it is "NA's: 1", and you can see that it is recognized as a missing value (NA).
There may be exceptions, but in the case of R, if you try to do something with a quantitative variable that contains missing values, it will be treated specially.
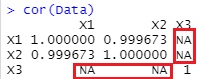
For example, if you ask for a correlation matrix, the correlation coefficient with a quantitative variable that contains missing values ??will be "NA" and cannot be found. For this reason, if you use a value other than a missing value, you will not know even if the correlation is high. By the way, with other software, the correlation coefficient using numerical values ??other than missing values ??may be obtained.
How you transform the missing values will change what you can analyze.
This is the case when rows with missing values ??are excluded.
If it doesn't make any sense to be missing, this is an easy way to do it. However, when a prediction model is created by this method, it cannot be predicted if it contains missing values ??in the data at the stage you want to predict.
Data <- na.omit(Data)
Output is below.
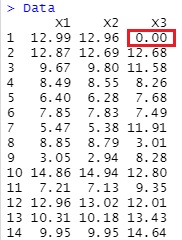
Depending on the background of the missing value and the policy of how to handle the missing value, for example, you want to treat the missing value as "0".
Data[is.na(Data)] <- 0
Output is below.
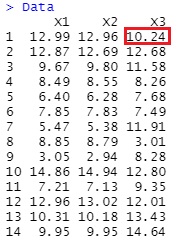
If you want the missing value of each variable to be the average value of the values ??other than the missing value of that variable, use the following.
for (i in 1:ncol(Data)) {
Data[,i][is.na(Data[,i])] <- mean(Data[,i], na.rm = TRUE)
}
Output is below.
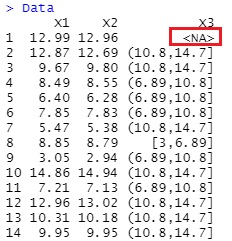
One-dimensional clustering is introduced on the page of Variable conversion by R, but if you use this method, "NA" becomes a category named "NA", and for other numerical values, one-dimensional clustering It will be processed.
For example,
Data[,3] <- droplevels(cut(Data[,3], breaks = 3,include.lowest = TRUE))
Output is below.
This is a conversion to infer the reason for the missing value from other variables.
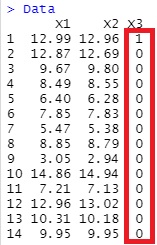
Data[,3][!is.na(Data[,3])] <- 0
Data[,3][is.na(Data[,3])] <- 1
Output is below.
If this is set this way, the variable with missing values Label Classification in the target variable of the technique, and whether they are missing, you can examine the relationship of other variables.
Depending on the Label Classification , the objective variable may not be numerical, but in that case, for example, the above "0" / "1" should be "A" / "B".
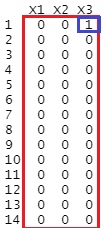
This is a method when you want to find out where and how missing values ??are contained in the data. For all variables, set 1 for missing values ??and 0 for non-missing values.
Data[!is.na(Data)] <- 0
Data[is.na(Data)] <- 1
Output is below.